Benchmarking and measuring Venture Capital performance has always been challenging. The metrics available are numerous with huge variability and VCs tend to highlight the ones that best fit their needs. Multiples are the most common measures of how much money an investment has made, but their limitation is that they are time agnostic. Highlighting that a fund has generated “3x” while its peer has generated “2x” is not very useful if we don’t know how long the process has taken. This is where IRRs come to work, incorporating the amount of time required to generate those returns. But this metric is also limited, because if a fund manager doesn’t call the capital committed, its IRR may still be high but make no money for investors. So how can an investor evaluate the performance of a fund? Let’s take it from the top.
There is an abundance of acronyms being used for measuring performance – Distributions to Paid In Capital (DPI), Total Value to Paid In Capital (TVPI), Residual Value to Paid In Capital (RVPI), Multiple on Invested Capital (MOIC), Net Asset Value (NAV), Fair Market Value (FMV), Gross IRR, net IRR, loss ratio, and many more are being used interchangeably. While some KPIs are objective, performance is basically measured by the funds themselves, and are based on the funds assessment of the Fair Market Value of their holdings in the portfolio companies. In most cases these valuations are based on last round valuations, but in recent years, marking up companies that did not raise capital for a long period of time became common, and private company book valuations became even more fuzzy.
The problem of benchmarking VC performance is amplified dramatically in times of significant market downturns. In the past 14 years, during this prolonged boom cycle, investors could safely expect that the marks of portfolio companies would only increase from round to round. We have seen TVPIs of funds inflating in the past five years, while DPIs of funds were growing, but at a much lower pace. In the long term – when the fund ends its life, the investor should expect that the DPI = TVPI. This means that the fund liquidates all of its assets and returns the money to its investors. Straightforward? Not so much…If we look at fund performance over the last twenty years, we see that the median DPI of funds across different vintages is significantly lower than the TVPIs reported by funds along the way… We believe that the same will be true for the TVPIs of recent vintages which have risen to unprecedented heights. The current market downturn, which in most tech sectors, was more like a crash, with public market valuations dropping 70-80% in most high growth tech companies, is not yet reflected in the reported TVPIs of most funds. It takes some time to correlate corrections between public market valuation, which are real-time, to private market valuation , which are mostly judgement calls of the fund managers themselves, and historically lagged public markets by a margin. This has some reasoning to it. Private venture backed companies are generally growing faster than their public market comparables, and private companies have the privilege of taking a long-term view of value creation and are not subject to the short-term verdicts of the public markets. Many of the companies will “grow into” their last round valuations, by the time they will need to raise capital again, and there is a case to be made for waiting with valuation adjustments as long as the company continues to grow and has significant runway until its next financing. Yet, taking a bigger picture view it is very clear that eventual DPI upon fund liquidity of the vintages of the last decade will be significantly lower than the current reported TVPIs.
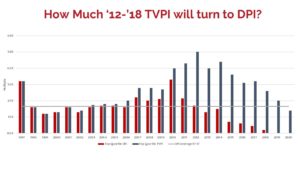
The above chart, taken from the incredible “all in” podcast is a very eye-opening look at fund results over the years. This chart follows the DPI and TVPIs of top-quartile venture funds in the US. As can be seen here, in funds which are nearing their end of life, DPI and TVPI converge, some vintages are markedly better than others. 1999 and 2000 vintages performed very poorly, at the height of the dotcom bubble. Post-bubble vintages, and more important post-financial-crisis vintages performed much better, but as can be seen, eventually TVPI turns into DPI, and the fund liquidates. When looking at the long-term median and averages of final venture DPI returns from older vintages, we see that the mean TVPI is around 2X, even though some vintages have outperformed that significantly. But when looking at the last ten years, in the prolonged boom period following the dotcom bubble burst, and the financial crisis of 2008, it is hard to believe that the TVPI of the 2011-2019 vintages will turn into DPI. It is much more likely that the final TVPI will revert to the long term mean of the previous decade, with some of the vintages outperforming.
So, if “cash is king” for businesses, “DPI is king” is for LPs. In order to best predict the success of the current generations of funds, you should take a close look at their current DPI, and how far it is from their current TVPI. Granted, some funds will be able to turn DPI to their current TVPI, but most will not. In current market conditions, DPI should weigh much more than TVPI in assessing the quality and projected outcome of funds. Funds that were focused on liquidity during the “unicorn bubble” of the past few years will become the winners of this cohort of funds.